Real-time Detection of RVC-based DeepFaked Audio
Privacy, Machine Learning, DeepFake
This was an independent project and based on the work of Bird & Lotfi [1]. This page presents a brief technical overview of the project. Please read the report here↗ for more information.
Background
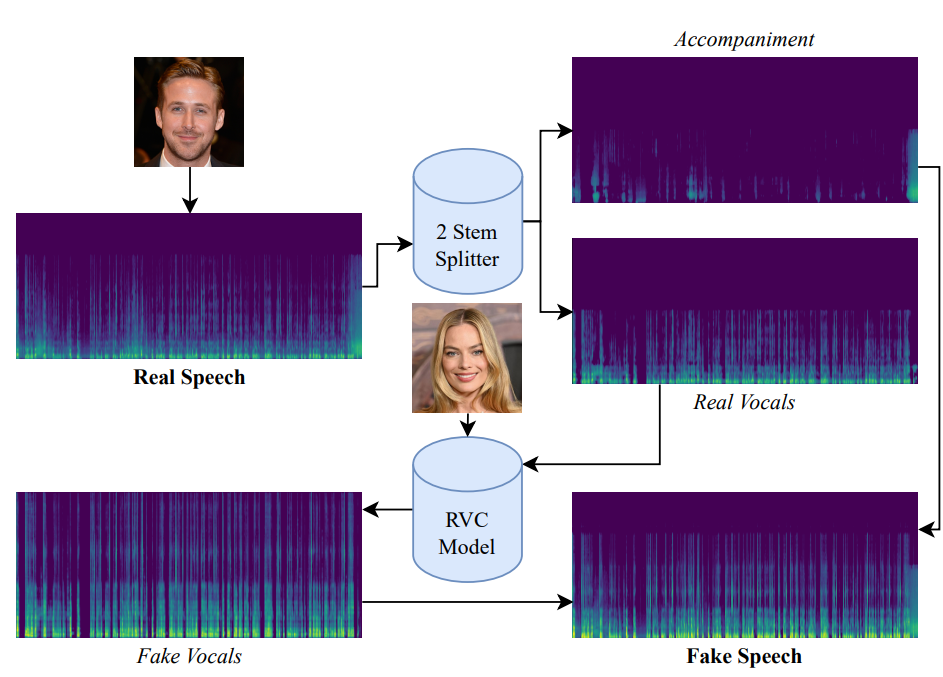
Retrieval-based Voice Conversion (RVC) extends this process by using a retrieval mechanism to enhance the converted voice qual ity. During the training process, RVC stores the target speaker’s acoustic feature representations, and the highly-relevant ones are retrieved during runtime to guide the inference process. Essentially, the similarity between the speech features of the target and the given speaker allows the model to more accurately reconstruct the target speaker’s timbre and vocal characteristics, while preserving the linguistic content, prosody, and style of the given speaker. RVC is designed to be deployed in real-time, such as via the RVC Web GUI. An overview of the RVC process is presented in Figure 2.
Objective
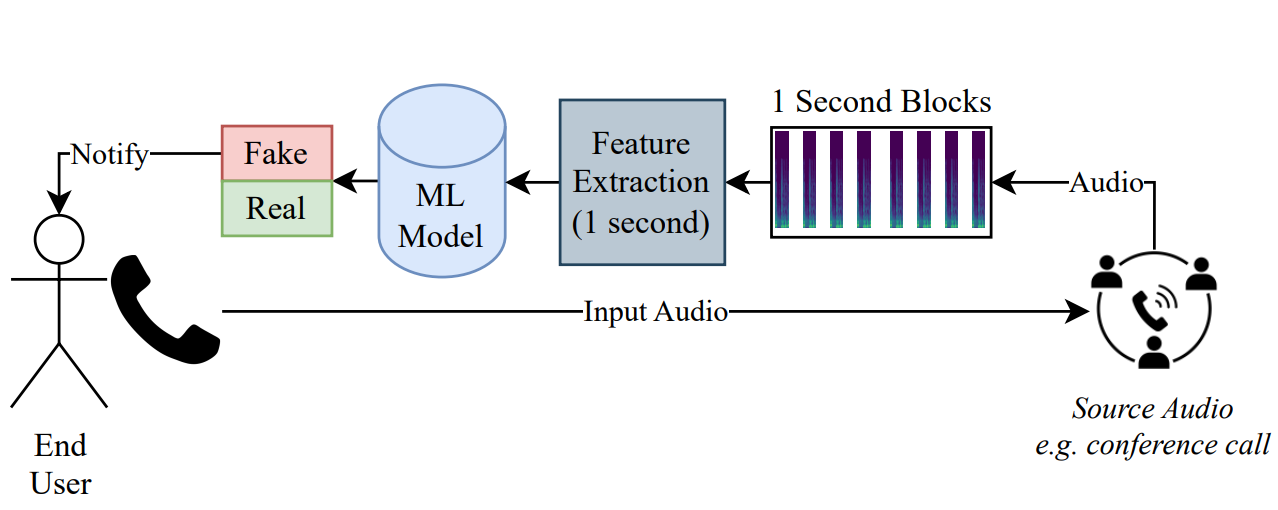
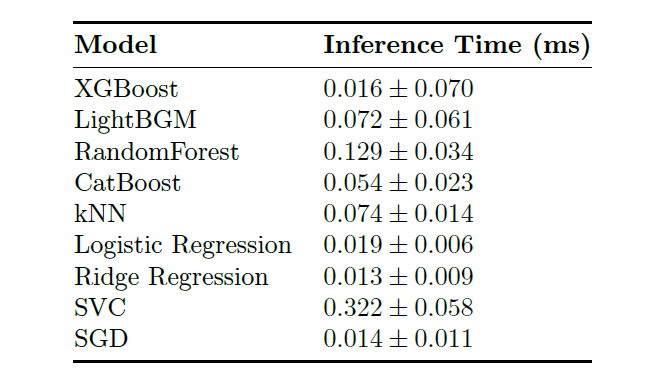
The ability to impersonate one's voice as another is an obvious threat to security, privacy, and integrity, especially when combined with real-time usage. Hence, the goal of this project is to use Machine Learning to detect the likelihood of RVC-based synthetic speech in real-time. Both detection capability and inference time (as well as feature processing time) are key metrics of efficient model performance in real-time pipelines; thus, classical statistical classifiers (kNN, SVMs, RandomForest, etc.) are chosen for this study.
Methodology
Voice Conversion
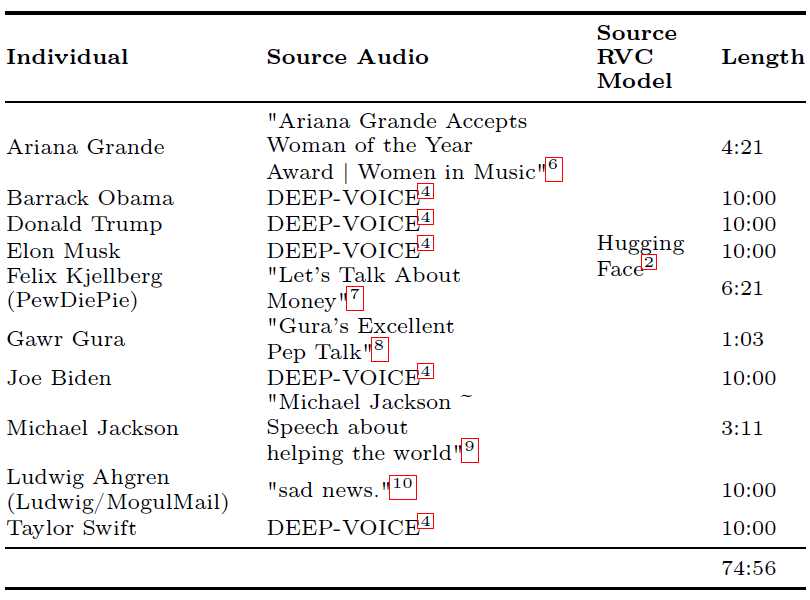
The 10 RVC models, each an individual speaker, are fed audio of the other 9. This results in 90 fake audio files. Random undersampling is used to combat imbalance, resulting in a 1:1 ratio with the real speech. See below some examples of real and fake audios.
Interactive Examples (press to play!)
| Real Audio | Fake Audio |
|---|---|
|
Source: Gura’s Excellent Pep Talk↗ |
Model: PewDiePie↗ |
|
Model: Barack Obama↗ |
|
|
Source: me! |
Model: Gawr Gura (Hololive)↗ |
|
Model: Lumine (Genshin Impact)↗ |
Feature Extraction
To enable real-time extraction, 1-second blocks of audio are treated as entire frames for feature extraction, with a hop (in seconds) of 63% of the sampling rate. librosa is used to extract the following features:
| Feature | Significance |
|---|---|
| Chromagram (12 bands) | Captures pitch changes (each band = a note in the Western musical scale) - useful for when speech and ambience are mixed. |
| Spectral Centroid | Represents the "brightness" or sharpness of the sound - higher values indicate more energy in high frequencies, useful for detecting timbre changes. |
| Spectral Bandwidth | Measures the spread of frequencies around the centroid - wide bandwidth suggests richer or noisier textures, narrow bandwidth indicates purer tones. |
| Root Mean Square (RMS) | Reflects the perceived loudness of the signal - higher RMS values indicate stronger energy and volume. |
| Spectral Rolloff | Marks the frequency below which a given percentage (typically 85%) of total spectral energy lies - useful for differentiating voiced and unvoiced sounds. |
| Zero Crossing Rate (ZCR) | Counts how frequently the signal changes sign - higher rates suggest noisier or more percussive sounds, while lower rates indicate smoother tones. |
| MFCC (20) | Mel-Frequency Cepstral Coefficients capture the overall shape of the spectral envelope - fundamental for identifying speaker characteristics and vocal timbre. |
Machine Learning
Selected for this study are the following statistical classifiers: XGBoost, Random Forest, Light Gradient-Boosting Machine (LightBGM), CatBoost, SVM, SGD, Logistic Regression, and Ridge Regression (all sourced from sklearn). Hyperparamaterization and 10-fold training is employed, and the best overall performer is evaluated.
In addition to traditional metrics (accuracy, precision-recall), the models were also evaludated based on the Matthews Correlation Coefficient (MCC) and Receiver Operating Characteristic Area Under the Curve (ROC-AUC).
Results
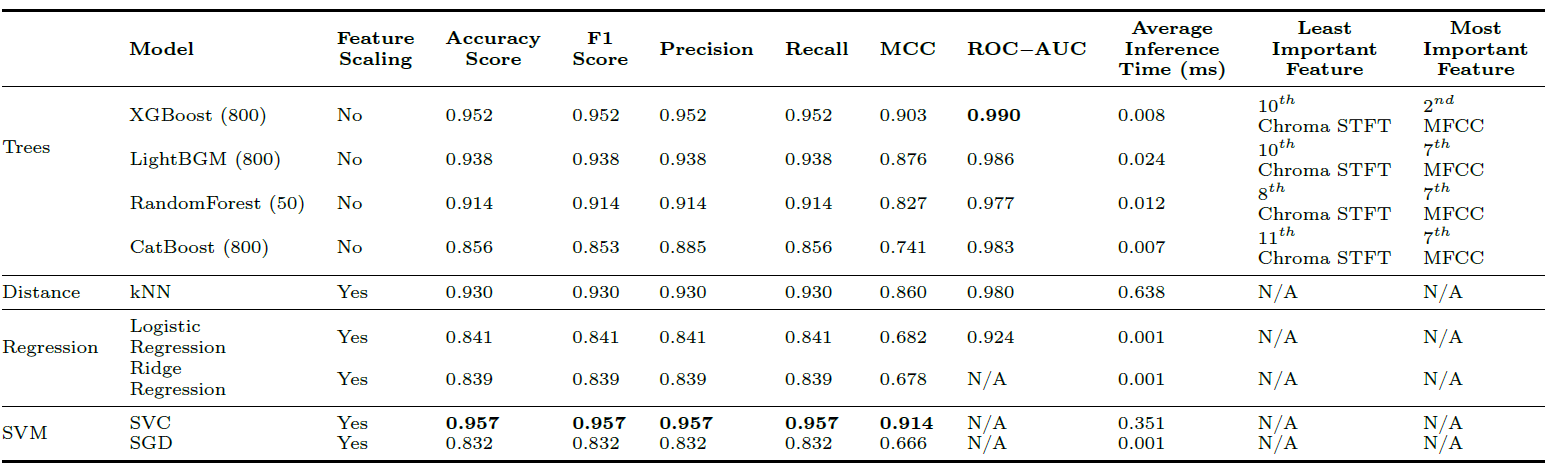
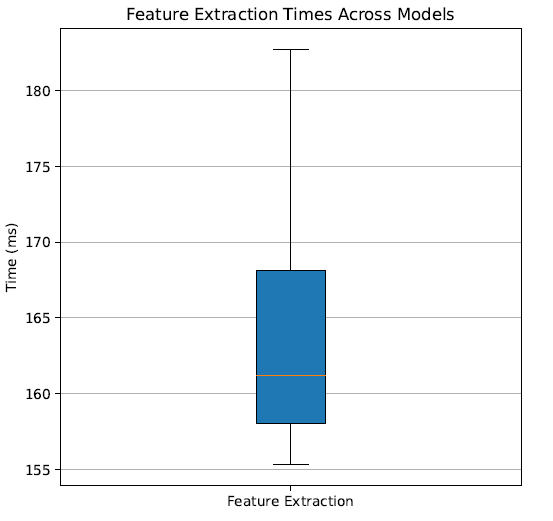
Combined with the average feature extraction time, each 1-second block takes on average 0.164 ± 0.03s to process, thus a rate of 5 to 7 blocks-per-second is achieved.
Discussion
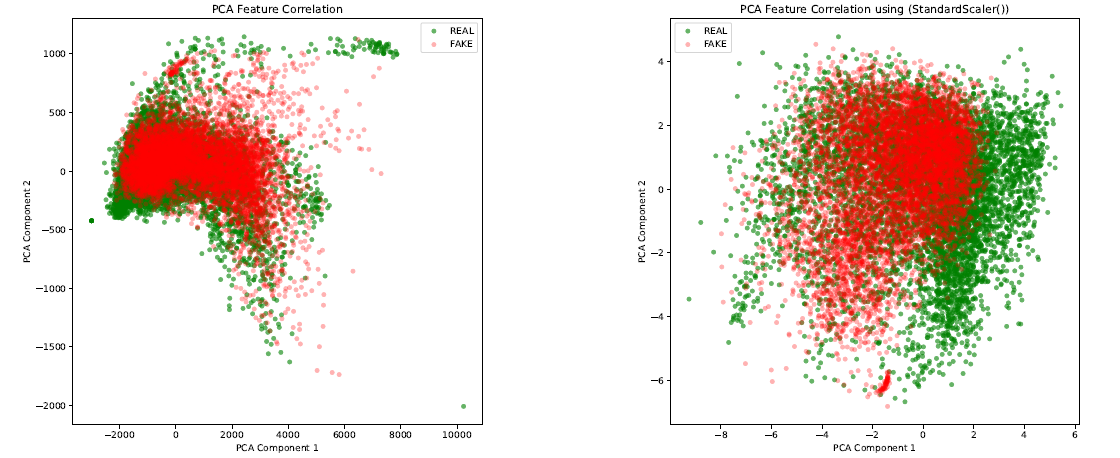
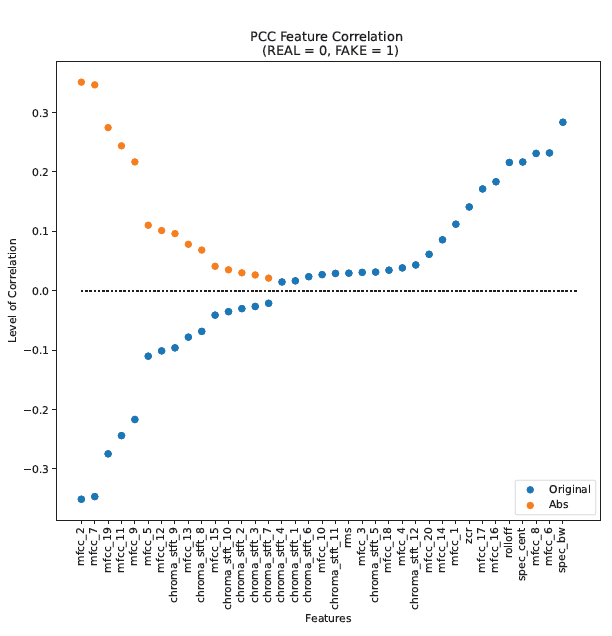
To better differentiate this work from [1], in addition to the Pearson’s Correlation Coefficient (PCC), I also used the Principal Component Analysis (PCA) to observe the correlation of features and classes of the generated dataset. The sorted PCC-based feature correlation is presented in Figure 5, where the points in orange represent the absolute value of the magnitude of correlation, with REAL = 0 and FAKE = 1. We see that the highest correlation magnitudes between feature and class is shown to be the 2nd MFCC, with a PCC of 0.35. The same observation was made in [1], though with a PCC of 0.36.
Interestingly, the 2nd MFCC is the lowest when considering its original negative (blue) values. This suggests that it is the strongest indicator of the REAL class. The highest correlation would therefore be attributed to the Spectral Bandwidth, with a PCC of 0.28, thereby being the strongest indicator of the FAKE class.
References
[1] J. J. Bird and A. Lotfi, “Real-time Detection of AI-Generated Speech for DeepFake Voice Conversion”, arXiv (Cornell University), Aug. 2023, doi: https://doi.org/10.48550/arxiv.2308.12734.